

A KPI dashboard is a simple, all-in-one screen that shows your business's most important numbers in one place, usually about 5 to 10 actionable KPIs so you don't get buried in noise. It functions similarly to the dashboard in your truck, but for your company's health.
If you're a remodeler, you probably have numbers scattered everywhere. One report from your CRM. One spreadsheet from your bookkeeper. One ad report. A few sticky notes. A feeling in your gut that work is moving, but not a clear answer to whether the right jobs are coming in, your sales process is tight, or your marketing is paying off.
That's where people get stuck. They're not lazy. They're not bad at business. They're trying to run a job site, lead a team, handle clients, and make payroll while their business data lives in ten different places.
A KPI dashboard fixes that problem by putting the few numbers that matter most on one screen, so you can check the health of the business fast and act before a small issue turns into a big one.
Table of Contents
- Feeling Lost in Your Business Numbers
- So What Is a KPI Dashboard Then
- Why a Dashboard Is Your Best Business Tool
- The Only KPIs a Remodeler Really Needs
- What a Good Remodeling Dashboard Looks Like
- Making Your Dashboard Work for You
- Common Mistakes and Your Next Steps
Feeling Lost in Your Business Numbers
Running a remodeling company without clear numbers feels a lot like showing up to a job site with tools tossed loose in the truck bed. You know the tools are somewhere. You know the work can get done. But everything takes longer because nothing is organized.
That's how a lot of owners run the business side. Leads live in one system. Sales notes sit in someone's inbox. Ad spend is in another login. Revenue is in accounting software. Then Monday comes, and you're trying to answer simple questions that shouldn't be hard.
Questions like:
- Are we getting enough qualified leads
- Are we setting enough appointments
- Are estimates turning into signed jobs
- Which lead source brings real projects, not tire-kickers
- Are we headed toward a strong month or a weak one
When those answers aren't clear, most owners do one of two things. They either go by gut, or they spend too much time digging through reports. Neither is a good long-term system.
You shouldn't have to play detective just to understand your own business.
A KPI dashboard gives you one place to look. Not fifty charts. Not every number under the sun. Just the handful of gauges that tell you whether the business is moving in the right direction.
That shift matters if you want to build a more data-driven marketing system for your remodeling business. Without one shared view, it's hard to connect marketing, sales, and revenue in a way that helps you make smart decisions.
Why this feels so frustrating
The hard part isn't that remodelers can't understand numbers. The hard part is that most numbers are presented badly. They come in disconnected chunks, with no story and no order.
A good dashboard is the opposite. It acts like a clean set of plans on a job site. You can glance at it and know what matters, what's behind, and what needs attention first.
What changes when you can see clearly
When your numbers are organized, you stop reacting blindly.
- You catch problems earlier: A drop in booked appointments doesn't hide for weeks.
- You focus your team better: Everyone knows which targets matter.
- You make fewer guess-based decisions: You can see whether a channel, salesperson, or process is helping or hurting.
That's its true value. A KPI dashboard isn't fancy software for its own sake. It's a cleaner way to run the shop.
So What Is a KPI Dashboard Then
A KPI dashboard is a screen that shows the most important numbers in your business, all in one place.
That sounds simple because it is simple.
Start with the truck dashboard idea
When you drive your truck, you don't need to understand every wire, sensor, and engine part. You just need the dashboard to tell you what matters right now. Speed. Fuel. Engine temperature. Warning lights.
Your business needs the same thing.
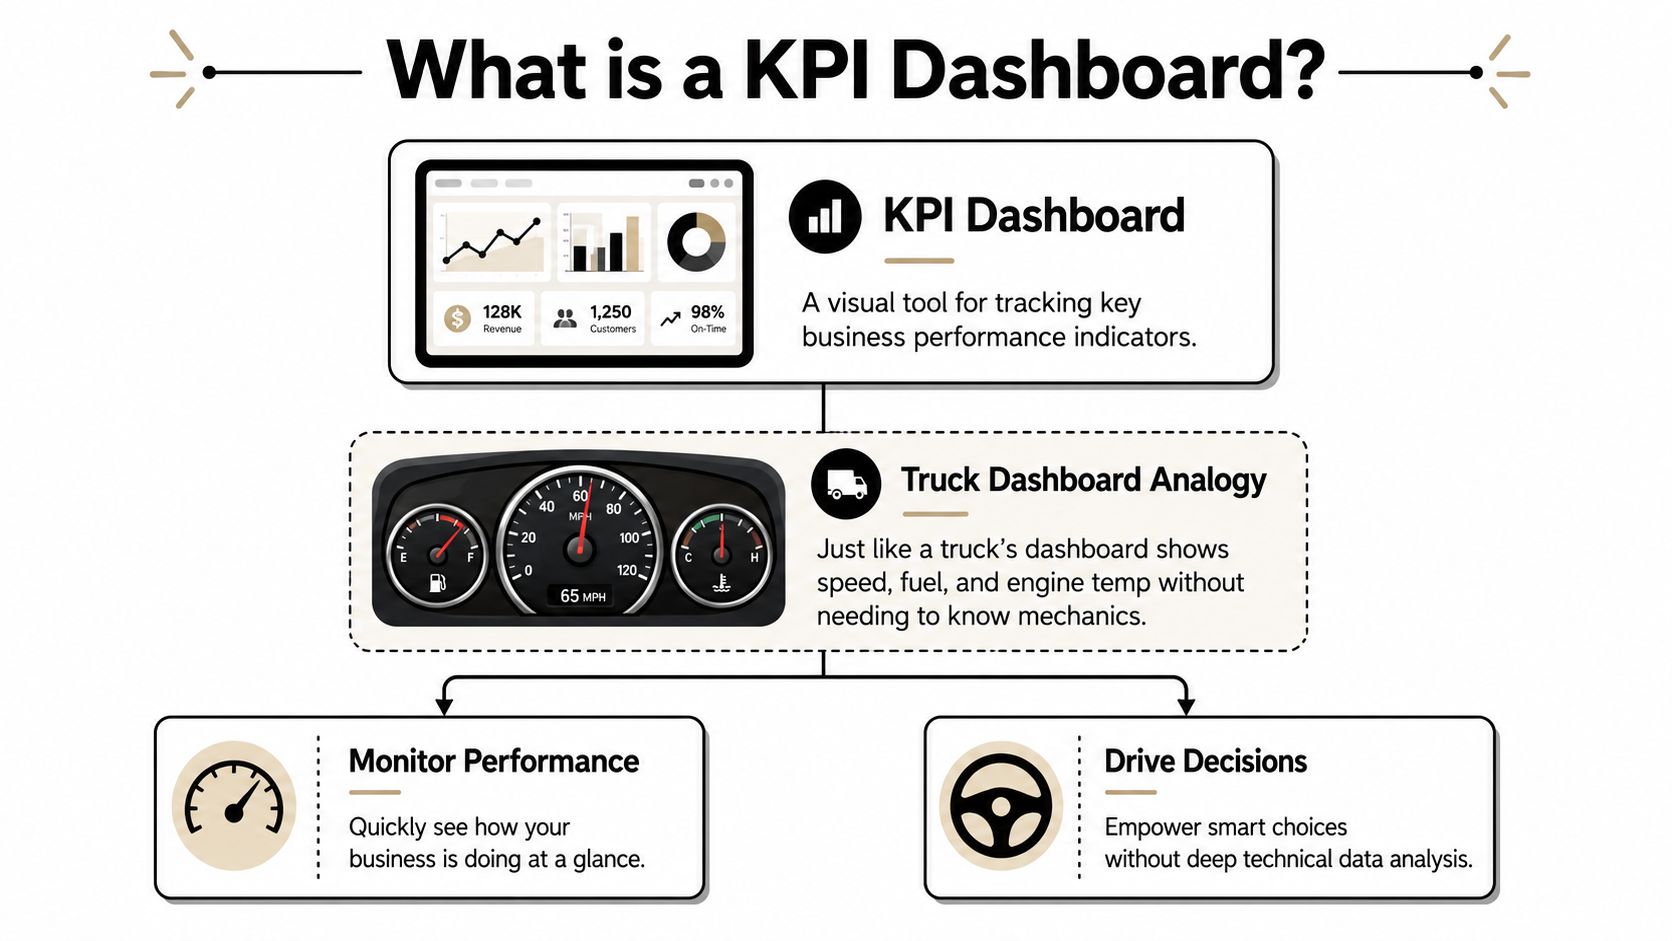
A KPI dashboard is a centralized visual display of the most important performance indicators in a business, usually pulling data from multiple systems into one view. Guidance also recommends keeping it focused on about 5 to 10 actionable KPIs so people don't get overloaded, and the most common types are strategic, operational, and financial dashboards according to Domo's KPI dashboard guide.
That word centralized matters. It means you don't have to log into five different tools just to answer one question.
KPI versus metric in plain English
People mix these up all the time.
A metric is any number you can measure. A KPI is one of the few numbers that tells you if the business is on track.
Think of your toolbox.
- A metric is every tool you own.
- A KPI is the tool you reach for constantly because it helps you finish the job.
If you're a remodeler, “website visits” might be a metric. It's interesting. But “qualified leads booked” is closer to a KPI because it connects to actual work.
Practical rule: If a number changes and you still wouldn't do anything differently, it's probably just a metric, not a KPI.
That's why a dashboard shouldn't show everything. It should show the numbers that lead to action.
The three main dashboard types
Different dashboards answer different business questions.
Here's the easy version:
| Dashboard type | What it tracks | Remodeler example |
|---|---|---|
| Strategic | Long-term goals | Are we growing the business we want |
| Operational | Day-to-day activity | Are leads, appointments, and jobs moving this week |
| Financial | Cost and revenue | Are jobs producing healthy revenue and margin |
A strategic dashboard is for the owner or leadership team. It's the big picture.
An operational dashboard is what you'd use to keep the machine moving every day. It helps you spot bottlenecks fast.
A financial dashboard tells you if the work you're winning is helping the company, not just keeping everyone busy.
For a remodeler, the best setup usually isn't one giant screen stuffed with charts. It's a small number of focused views, each built for a clear job.
Why a Dashboard Is Your Best Business Tool
On a job site, you would not wait until the end of the week to find out a cut was off, materials were short, or the crew lost half a day. You want to catch the problem while it is still small. A dashboard does the same job for your business.
It gives you a quick read on the parts of the company that create revenue, protect margin, and keep jobs moving.
It gives you one place to check the health of the business
Without a dashboard, numbers usually live in too many places. Leads sit in one system. Estimates sit in another. Revenue lives in bookkeeping. Marketing results are somewhere else.
That setup turns basic questions into scavenger hunts.
A good dashboard works like the top drawer of your toolbox. The tools you use most are all in one place, easy to grab, and easy to trust. Instead of chasing updates across spreadsheets, inboxes, and software logins, you open one view and see where the business stands today.
It saves hours of reporting work
Many remodeling owners are still paying for the same number twice. First, they pay someone to gather it. Then they pay managers to sit in meetings while everyone waits for it.
A dashboard cuts out much of that manual work because the numbers are already organized and visible.
That matters more than it sounds. Every hour spent building reports by hand is an hour not spent following up on leads, reviewing jobs, coaching sales, or fixing a production issue before it gets expensive.
It helps you make steadier decisions under pressure
Stress usually gets worse when the picture is blurry.
If the phone feels quiet, you start wondering whether marketing is slipping. If signed jobs slow down, you question the sales process. If cash feels tight, you may not know whether the issue is volume, pricing, or margin. Seeing your remodeling profit margin benchmarks and warning signs alongside lead and sales numbers gives you needed context.
A dashboard brings that context into view. You can separate a real problem from a normal dip, which makes your next decision more measured and more useful.
Good dashboards reduce second-guessing because they show where the issue starts.
It helps you catch problems while they are still fixable
Speed matters, but clarity matters more.
When your numbers are visible in one place, weak spots show up earlier. You are no longer waiting for month-end to realize something drifted off course.
For example:
- Leads increase, but appointments stay flat: your marketing may be bringing in attention, but follow-up may be too slow or too inconsistent.
- Appointments happen, but signed jobs lag: the issue may be in the sales conversation, the offer, or how estimates are being presented.
- Average project value drops: your team may be winning work, but too much of it may be small jobs that keep crews busy without improving the business much.
For a remodeler, that early warning matters. It is the difference between making a small adjustment now and cleaning up a bigger mess later.
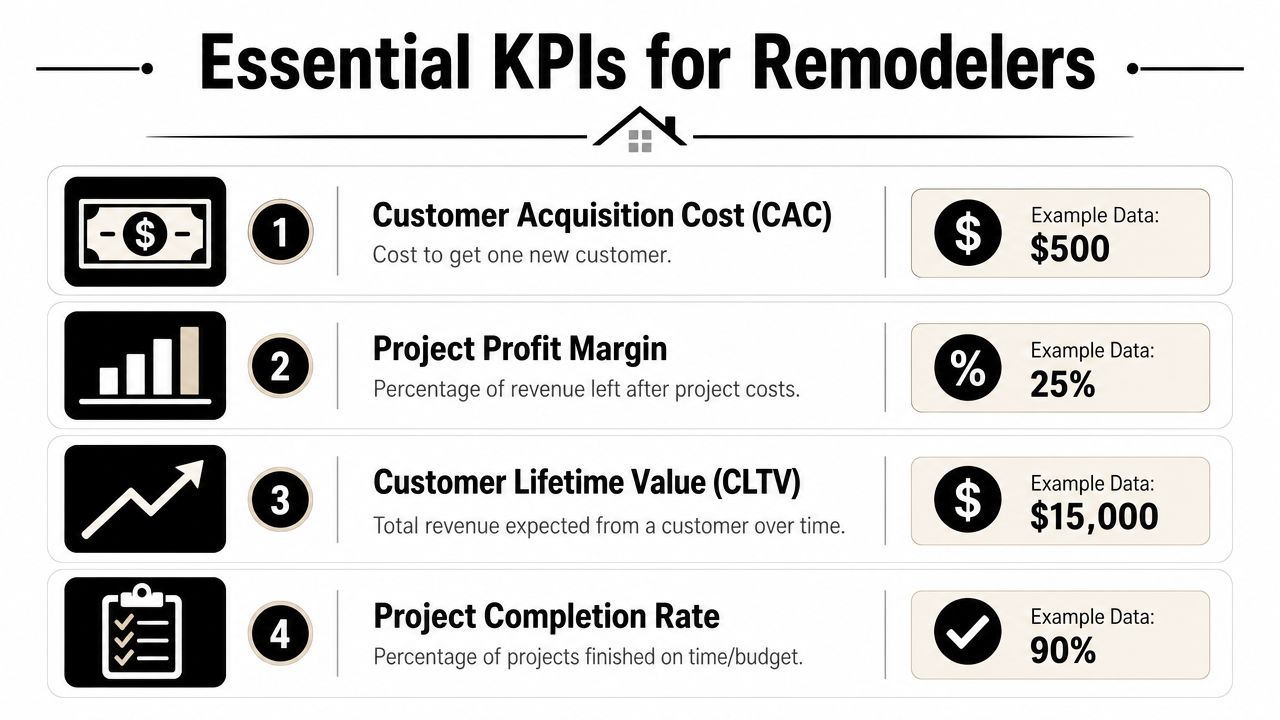
The Only KPIs a Remodeler Really Needs
Most remodeling businesses don't need a fancy dashboard stuffed with random charts. They need a short list of numbers tied to lead quality, sales movement, and job value.
That's it.
If you try to track everything, you'll end up looking at nothing.
Start with the numbers tied to revenue
These are the first gauges most remodelers should care about.
- Qualified leads: How many real opportunities came in. Not every call. Not every form fill. Real homeowners with real projects in your service area.
- Appointments set: How many of those leads turned into consultations or estimate appointments.
- Show rate: How many scheduled appointments happened.
- Close rate: How many qualified opportunities turned into signed jobs.
- Average project size: The average value of the jobs you win.
- Sales pipeline value: The total value of open opportunities still in play.
These numbers work together like a chain. If one link weakens, revenue usually feels it later.
Here's a simple way to think about them:
| KPI | Simple question it answers | Why it matters |
|---|---|---|
| Qualified leads | Are the right people contacting us | Shows whether marketing is attracting fit |
| Appointments set | Are we moving leads forward | Reveals follow-up strength |
| Show rate | Are prospects serious enough to meet | Helps spot friction before the sales call |
| Close rate | Are we winning enough of the right jobs | Shows sales effectiveness |
| Average project size | Are we landing the project types we want | Protects positioning and revenue quality |
| Pipeline value | Do we have enough future work in motion | Helps with hiring and forecasting |
Track the handoff from marketing to sales
A lot of owners stop at lead count. That's where confusion starts.
If a campaign brings in many inquiries but few qualified appointments, that doesn't mean the campaign is healthy. It may just be loud.
For remodelers, the better dashboard usually includes a few handoff KPIs:
- Lead source by quality: Which channels bring the right kinds of homeowners.
- Response speed: How quickly your team follows up.
- Booked appointment rate: How often new leads become real sales conversations.
- Close rate by lead source: Which channels produce signed projects, not just activity.
This is also where digital platforms like Google Ads and Google Business Profile should be judged carefully. Clicks and views can be interesting, but they aren't the main event. Qualified phone calls, form submissions, booked appointments, and signed work show the full picture.
If you're trying to tie lead quality back to healthy financial performance, it helps to understand construction profit margin basics for contractors. Winning more jobs only helps if you're winning the right jobs.
Keep vanity metrics in the background
Some numbers feel exciting because they move a lot. That doesn't make them useful.
Website traffic, social likes, and raw impressions can sit in a side panel if you want them. They just shouldn't be the gauges you steer by.
If a number looks impressive but doesn't help you book, sell, or deliver profitable work, it doesn't deserve the center of the dashboard.
A remodeler's dashboard should answer practical questions. Are we bringing in the right opportunities. Are we converting them. Are they large enough and healthy enough to grow the business we want.
That's the list to build around.
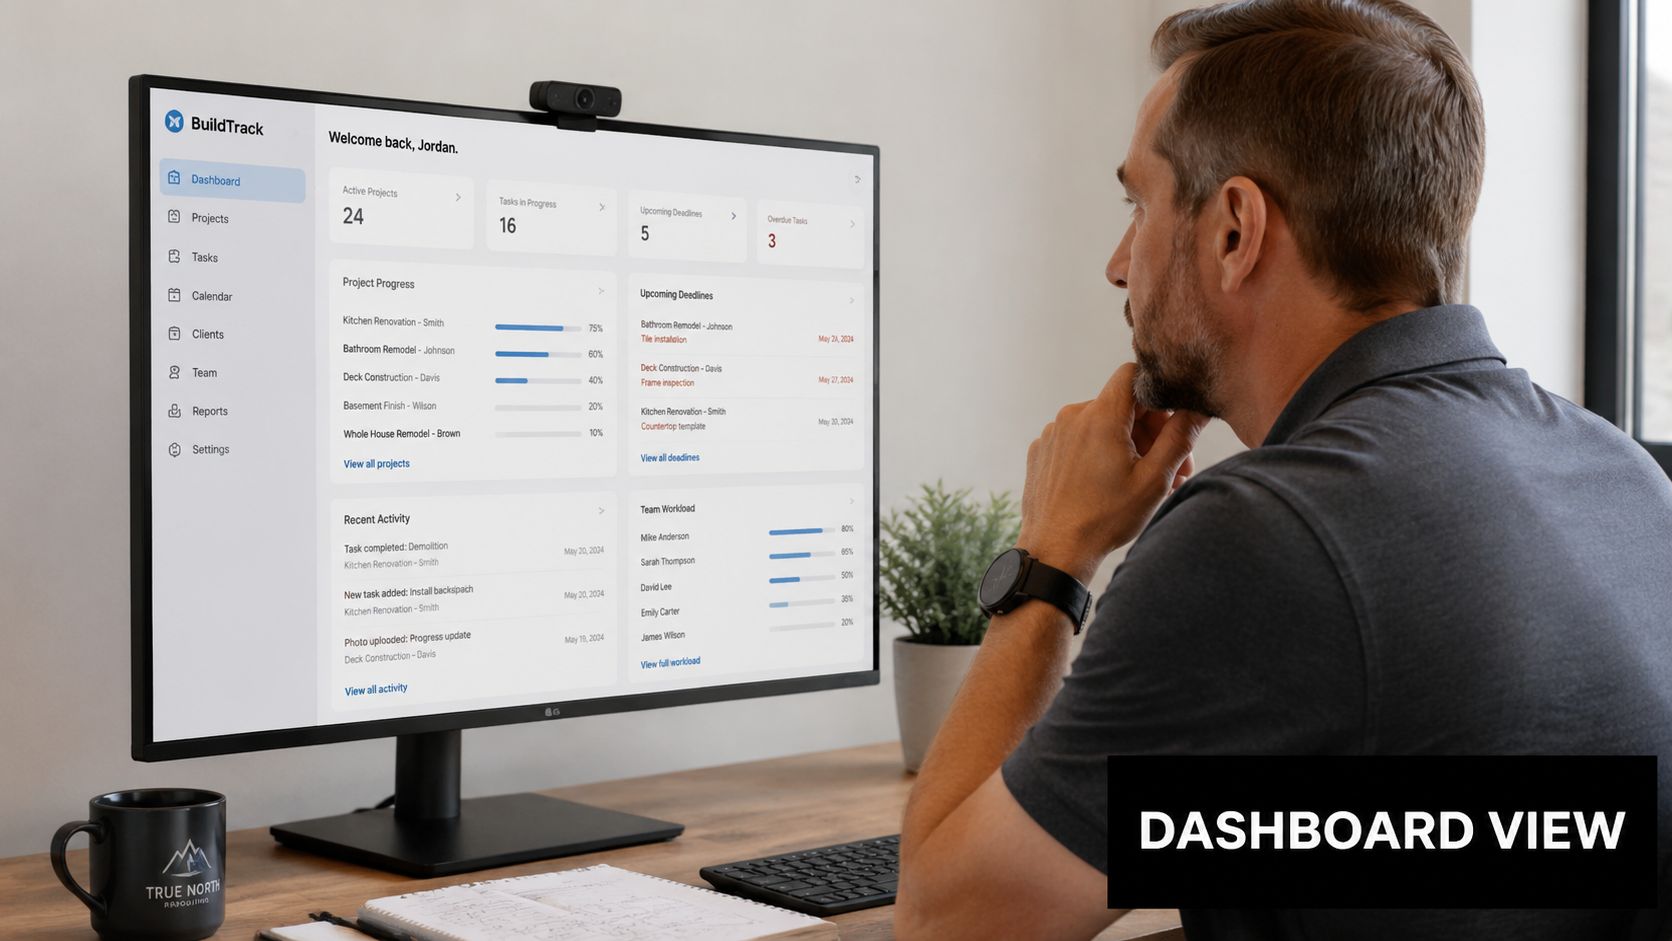
What a Good Remodeling Dashboard Looks Like
A good remodeling dashboard doesn't look like an airplane cockpit. It looks clean. A few rows. A few charts. Clear labels. Fast answers.
When it's built well, you can glance at it in the morning and know where to focus.
A marketing dashboard example
Picture one screen for your marketing view.
Across the top, you might see lead source tiles. Google Ads. Organic search. Google Business Profile. Referrals. Website forms. Under that, a small trend line shows whether qualified leads are rising, falling, or staying steady.
Then you'd place the next layer of numbers under it:
- Qualified leads by source
- Booked appointments by source
- Lead-to-appointment movement
- Phone calls and form submissions that turned into real opportunities
That kind of screen answers practical questions fast. Is one channel producing junk. Is another channel producing fewer leads but better-fit homeowners. Is follow-up breaking after the lead comes in.
A sales dashboard example
Now picture a second screen for sales.
At the top sits pipeline value, because that tells you how much possible future work is currently being worked. Below it, you might see opportunity stages such as new lead, appointment scheduled, estimate delivered, follow-up, and closed won.
A sales dashboard for a remodeler often includes:
| Dashboard area | What you'd see | What it helps you answer |
|---|---|---|
| Pipeline | Open opportunities by stage | Do we have enough work in motion |
| Conversion | Close rate by source or salesperson | Where are deals getting won or lost |
| Project value | Average project size | Are we attracting and closing ideal jobs |
One look should tell a story. Maybe the pipeline is full, but estimates are stalling. Maybe close rate is solid, but average project size is slipping. Maybe one lead source produces better-fit homeowners than another.
That's what a useful dashboard does. It turns scattered activity into a readable story.
Keep the layout simple
A strong dashboard usually has:
- A top row of headline numbers
- A middle section with trend charts
- A lower section with breakdowns by source, stage, or team member
If the screen feels crowded, it's probably trying to do too much. The best dashboards feel more like a neatly organized tool chest than a pile of parts.
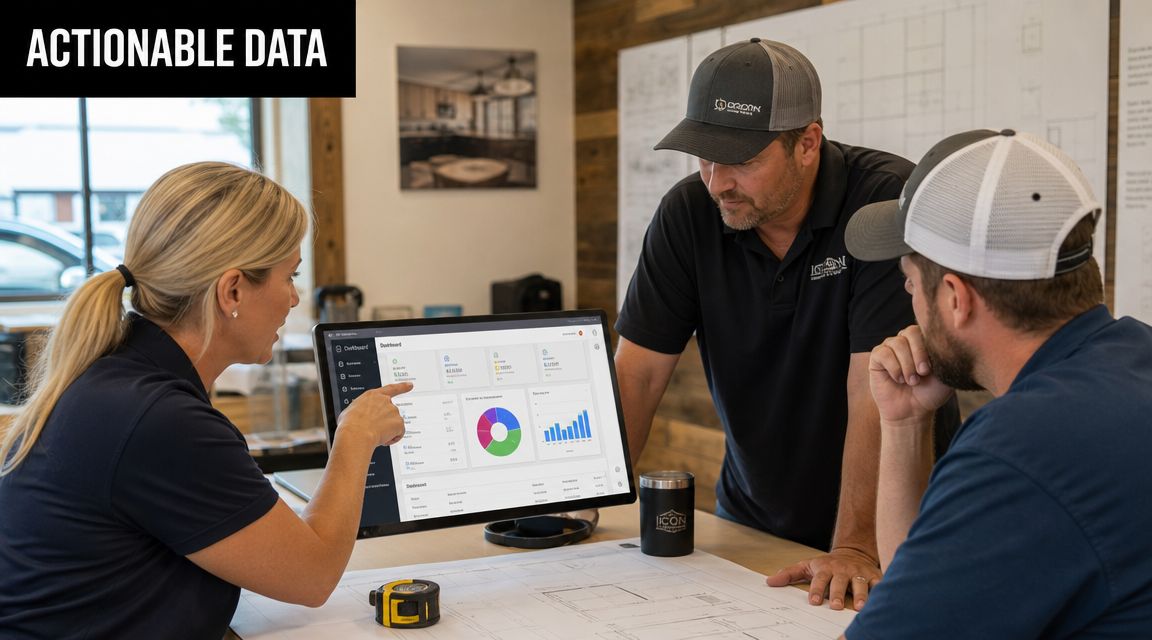
Making Your Dashboard Work for You
A dashboard helps only when your team can use it fast, trust what they see, and know what action comes next.
For a remodeler, that matters more than fancy design. On a busy week, nobody has time to stare at charts like they are architectural plans. Your dashboard should work more like the gauge cluster in your truck. A quick look should tell you whether you are on track, running low, or heading toward a problem.
Use simple visuals your team can read fast
Clear visuals reduce hesitation.
Use charts the way you use signs on a job site. They should guide attention right away, not require interpretation.
- Bar charts: Best for side-by-side comparisons, like lead sources, sales reps, or close rates by campaign.
- Line charts: Best for trends over time, like weekly leads, booked appointments, or pipeline value.
- Tables: Best when exact numbers matter and labels need to stay attached.
- Pie charts: Usually harder to scan quickly, so they rarely earn a spot on a remodeler's main dashboard.
If someone on your team needs several minutes to explain what a chart means, the chart is too complicated.
Connect your systems so the dashboard stays useful
A good dashboard pulls together the numbers that usually sit in different places. Your ads may live in one platform. Your form fills may land somewhere else. Your sales notes may live in the CRM. If those systems stay separate, your team ends up building reports by hand and guessing at what happened between lead and signed job.
Connected systems fix that. They let the source of the lead, the follow-up activity, and the sales result show up in one view.
For a remodeling company, that often looks like this:
- A homeowner fills out a form from Google Ads
- The CRM saves the lead source automatically
- Follow-up tasks get assigned
- The appointment result gets logged
- The opportunity stage updates the pipeline screen
That setup makes it easier to spot where work is getting stuck. If you want a practical starting point, this guide to CRM software for builders explains what to look for.
Learn how to read the story behind the numbers
The underlying value is not the chart itself. It is the pattern behind it.
A remodeler's dashboard works like opening a toolbox and seeing what is missing before the job slows down. One number by itself can be interesting. A few numbers together can show the underlying problem.
Here are a few examples:
Leads are rising, but appointments are flat. That usually points to a follow-up, qualification, or scheduling issue.
If appointments are strong but close rate is weak, the problem may be in the sales conversation, the offer, or the quality of the leads coming in.
If close rate looks healthy but revenue stays flat, your average project size may be too low.
This is why a short weekly review works so well. You are not holding a long meeting. You are checking the main gauges, asking what changed, and deciding what needs attention first.
Common Mistakes and Your Next Steps
Most dashboard problems aren't technical. They're judgment problems.
People either track too much, look too rarely, or obsess over numbers that don't help them make money.
The mistakes that make dashboards useless
The most common mistakes are easy to spot:
- Too many KPIs: When the screen is crowded, nothing stands out.
- No review habit: A dashboard only works if someone checks it.
- Vanity metrics in the spotlight: Activity isn't the same as progress.
Another common mistake is building one giant dashboard for everyone. Owners, salespeople, and office staff often need different views. One screen for every person usually becomes one screen that serves nobody well.
A simple way to start
You don't need a perfect setup on day one. You need a workable habit.
Start like this:
- Pick a short list: Choose only a few KPIs that connect directly to growth.
- Put them in one place: Use your CRM or even a simple spreadsheet if that gets you moving.
- Review them every week: Put a short check-in on the calendar and protect it.
Small, consistent visibility beats a complicated dashboard nobody uses.
If you're still asking what is a KPI dashboard, the plain answer is this: it's your business control panel. It helps you stop driving by guesswork and start steering with a clear view of what matters most.
If you want help turning scattered lead, sales, and marketing data into a dashboard you'll find useful, Constructo Marketing works specifically with remodelers. They help contractors connect lead generation, CRM follow-up, and KPI visibility so owners can see what's working, fix what isn't, and grow with more confidence.